RFM segmentation: a practical guide, data and activation
RFM segmentation turns customer data into clear decisions. Identify opportunities, design campaigns and predict behaviour.

Gastón Kehyaian
COO
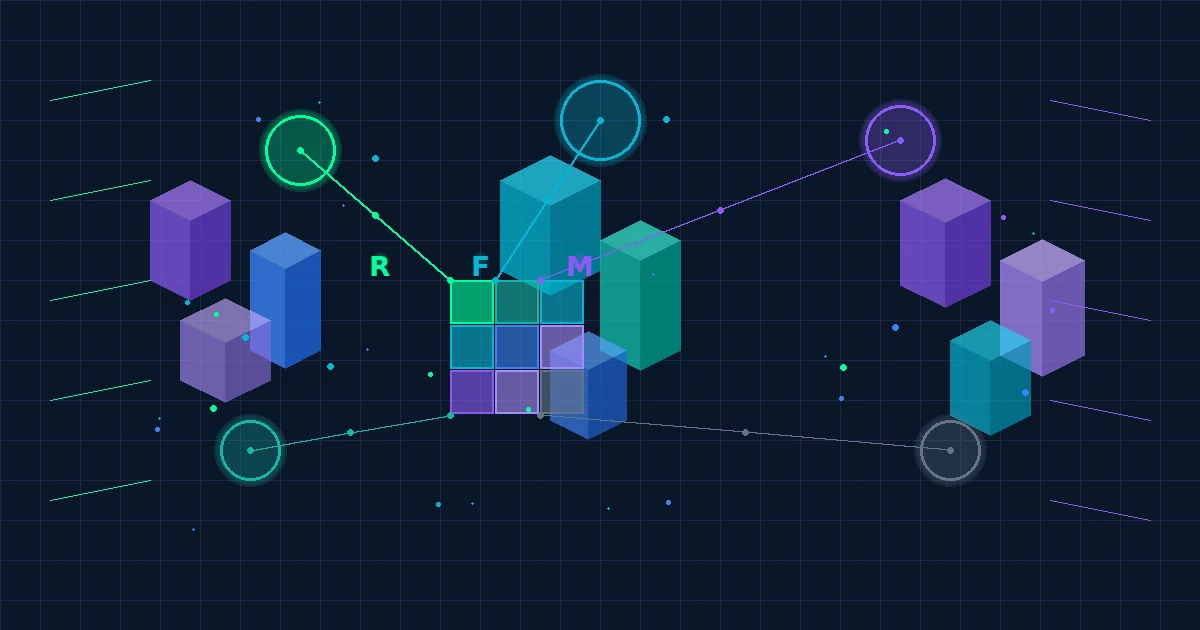
RFM segmentation turns customer data into clear decisions. With recency, frequency and monetary value you will identify opportunities, design campaigns and predict behaviour. Here you will find the fundamentals, step-by-step calculations, integration with CLV and predictive models, visualizations and activation by segment. Apply the best practices and optimize retention and growth.
1. The foundation of RFM analysis
RFM analysis (Recency, Frequency and Monetary value) is one of the most effective methodologies for segmenting customers and understanding their purchasing behaviour. Although it emerged decades ago in the world of direct marketing, today it is gaining strength again thanks to mass access to data and how easy it has become to automate RFM scoring with modern tools.
The technique makes it possible to identify which customers are the most valuable, which are at risk of churning, and where to concentrate retention, loyalty or reactivation efforts.
1.1 Definition and components (recency, frequency, monetary value)
RFM analysis rests on three key variables:
- Recency (R): how much time has passed since the last purchase
- Frequency (F): how many purchases the customer has made in a given period
- Monetary value (M): how much money they have spent in total
Each customer receives an RFM score combining these three factors, making it possible to prioritize actions and classify the customer base according to its current and potential value.
1.2 Benefits and main use cases
Among the main benefits of RFM scoring:
- Segmenting customers by their real behaviour
- Detecting upselling and cross-selling opportunities
- Identifying customers at risk of churn
- Designing precise, profitable RFM reactivation campaigns
- Assessing the health of the business in terms of loyalty and recurrence
1.3 Context and history of the technique
The RFM model was developed in the 1960s by catalogue sales companies that needed to optimize the mailing of physical promotions. With the rise of ecommerce and digital CRM, the methodology has been completely renewed, and today it integrates with machine learning, Python and large-scale data analysis to generate dynamic segmentations.
1.4 Limitations and key considerations
RFM does not capture every nuance of customer behaviour (motivations or non-transactional interactions, for instance). It also requires proper cleansing and normalization of the data to avoid bias. Its greatest value emerges when combined with predictive models or CLV (Customer Lifetime Value), which extend the view into the future.
2. Practical examples and use cases
This section illustrates how to apply the RFM calculation step by step and how to use it in different industries to obtain actionable insights.
2.1 A step-by-step example of the RFM calculation
Suppose an ecommerce business with the following data:
| Customer | Last purchase date | No. of purchases | Total spent (USD) |
|---|---|---|---|
| A001 | 15/10/2025 | 10 | 850 |
| A002 | 02/09/2025 | 3 | 150 |
| A003 | 25/10/2025 | 5 | 400 |
Steps in the calculation:
- Recency: calculate days since the last purchase
- Frequency: count the number of purchases
- Monetary value: sum the total spent
- Assign RFM quartiles or quintiles (from 1 to 5, for instance) according to relative position
- Combine the three scores into an RFM map, for example:
- A001 = 555 (champion)
- A002 = 211 (lost)
- A003 = 434 (potentially loyal)
2.2 Use cases by industry
- Retail and ecommerce: RFM segmentation for promotions, coupons or loyalty
- SaaS or subscription: detecting inactive customers and preventing churn
- Banking and insurance: identifying high-value or high-risk customers
- Professional services: prioritizing accounts with greater recurrence
2.3 Examples of campaigns and messages by segment (templates)
- Champions: "Thank you for your loyalty. We are rewarding you with early access to our offers."
- Loyal: "Your consistency deserves exclusive benefits."
- At risk: "We noticed you have not visited us in a while. Here is 20% off."
- Lost: "We want to see you again. Come back and receive a welcome gift."
These RFM commercial tactics help increase retention and LTV (Lifetime Value).
3. Calculation and data preparation
The success of the analysis depends largely on data preparation and structure. Here is how to build a solid base for reliable results.
3.1 Gathering and structuring data per customer
It is advisable to consolidate all transactions into a single dataset with the following fields:
- Customer ID
- Purchase date
- Amount
- Channel or product
nBlock, for example, automates this process even when the data comes from invoices, spreadsheets or unstructured systems, applying machine learning models that clean and unify the information before the calculation.
3.2 Calculating recency, frequency and monetary value
- Recency (R): the difference between the current date and the last purchase
- Frequency (F): the number of transactions
- Monetary value (M): the average or total spent
In Python, this can be calculated easily with groupby() and agg() over the purchase records.
3.3 Scoring by quantiles and assigning ranges (1–5)
Each metric is converted into a score. For example:
- Lowest recency = 5 (most recent)
- Highest frequency and monetary value = 5
The final RFM score is expressed as a concatenation, such as "455".
3.4 Tools and automation for the analysis
There are multiple tools: from Python notebooks to SaaS platforms like nBlock, which generate the RFM segmentation automatically and visualize results in an interactive dashboard.
3.5 Best practices: period, outliers and margins
- Use a relevant analysis period (the last 12 months, for instance)
- Exclude outliers that distort the average
- Review profitability margins before offering mass discounts
4. Integration with CLV and predictive models
The real power of RFM emerges when it is combined with models that predict future value.
4.1 Using RFM as variables for CLV
The three RFM dimensions are excellent features for estimating Customer Lifetime Value (CLV). Customers with high frequency and monetary value tend to have a longer expected lifetime, so RFM serves as a starting point for training regression or machine learning models.
4.2 Survival analysis to predict churn
Survival analysis makes it possible to estimate the probability that a customer remains active over time. Integrating RFM into this kind of model allows retention curves to be calculated per segment and reveals when it makes sense to launch RFM loyalty campaigns or retention actions.
4.3 Regression and ML for future value
Regression models, Random Forest or XGBoost can use the R, F and M variables together with additional data (channel, product or geography, for instance) to estimate each customer's expected future value. This kind of predictive RFM clustering is the foundation of modern commercial intelligence.
5. The resulting RFM segmentation
Once the scores are assigned, customers can be grouped according to typical combinations, generating a 5×5×5 RFM matrix.
5.1 A list of typical segments and their description
| Segment | Typical RFM code | Description |
|---|---|---|
| Champions | 555 | Buy often, recently and with high spend |
| Loyal | 4–5/4–5/3–5 | Buy frequently and invest well |
| Potentially loyal | 3–4/3–5/3–4 | Promising if recurrence is encouraged |
| At risk | 2–3/3–4/3–5 | Have not bought in a while, but carry value |
| Lost | 1–2/1–3/1–3 | Have left or barely bought at all |
These RFM segments become a strategic guide for marketing, service and sales decisions.
5.2 Visualization in a matrix and dashboard
The RFM map can be represented as a matrix or heatmap where each cell reflects the density of customers in a group. Tools like Power BI or nBlock's dashboards make dynamic visualization easy, allowing filtering by country, channel or product.
5.3 Interpreting behaviour and the health of the business
A high percentage of "Champions" indicates a healthy business. An increase in "At risk" or "Lost" suggests reviewing the retention and reactivation strategy. Analysing the monthly evolution of the RFM map makes it possible to detect trends in loyalty or defection before they hit sales.
6. Activation and tactics by segment
RFM analysis is not an end in itself: its real value emerges when you activate personalized campaigns for each customer group.
6.1 Marketing objectives and success metrics
Each segment should have a clear objective:
- Champions: maintain satisfaction (metric: NPS or recurrence)
- Loyal: encourage complementary purchases (metric: average order value)
- At risk: reactivate with promotions (metric: return rate)
- Lost: recover or clean the base (metric: post-reactivation conversion rate)
6.2 Recommended actions by priority group
- Champions: VIP programmes, early access, referral marketing
- Loyal: bundles, cumulative benefits
- At risk: temporary discounts or personalized messages
- Lost: multichannel re-engagement campaigns
These RFM commercial tactics can be executed automatically from email marketing platforms or the CRM.
6.3 Personalizing campaigns and promotions
RFM for email marketing is one of the most profitable applications. Each message can be adapted according to the RFM score — tone, content and offer. For example:
- The "Champions" segment: a tone of exclusivity
- The "At risk" segment: an empathetic, benefit-oriented tone
- The "Lost" segment: a direct incentive or emotional storytelling
6.4 Retention, reactivation and lifecycle
RFM analysis also makes it possible to map the customer lifecycle, from their first purchase to their departure. Implementing RFM loyalty campaigns based on these moments helps keep the relationship active. With tools like nBlock, this cycle can be automated thanks to machine learning algorithms that detect segment changes in real time.
7. Conclusion
RFM analysis is a classic technique reinvented for the era of big data and machine learning. It makes it possible to identify behavioural patterns, prioritize resources and build a more intelligent relationship with every customer.
When combined with future value predictions (CLV), automation and dashboard visualization, it becomes an integrated commercial intelligence system.
At nBlock we are taking this concept to the next level, applying AI models capable of processing unstructured data — invoices, spreadsheets or emails — and generating automatic insights on loyalty, risk and growth opportunities.
In a competitive environment where personalization and retention are key, mastering RFM scoring is no longer a technical advantage: it is a strategic necessity.
Want to know how nBlock can help your business? Book a demo with our team.
Written by
Gastón Kehyaian
COO
Over 20 years of executive experience in management, finance and digital transformation. MBA, MND, specialist in digital transformation.
Ready to turn on your first block?
We will show you where the hidden value is in your operation, on your own ERP. No strings attached.
Book a demo →